Following cooler-than-normal temperatures in January and February, Lower 48 weather has been net-bearish for natural gas operators and traders holding bullish positions.
Below is a chart showing average population-weighted temperatures (light blue line) versus the ten-year climate normal for the Lower 48. Monthly temperature anomalies, or departures from normal, are shown in grey.
Certain months of the year favor either heating or cooling demand, so if you are positioned bullishly in natural gas, you generally hope for colder-than-normal weather between October and April to drive heating demand. Conversely, between May and September, you would prefer hotter-than-normal weather to increase cooling-related consumption.
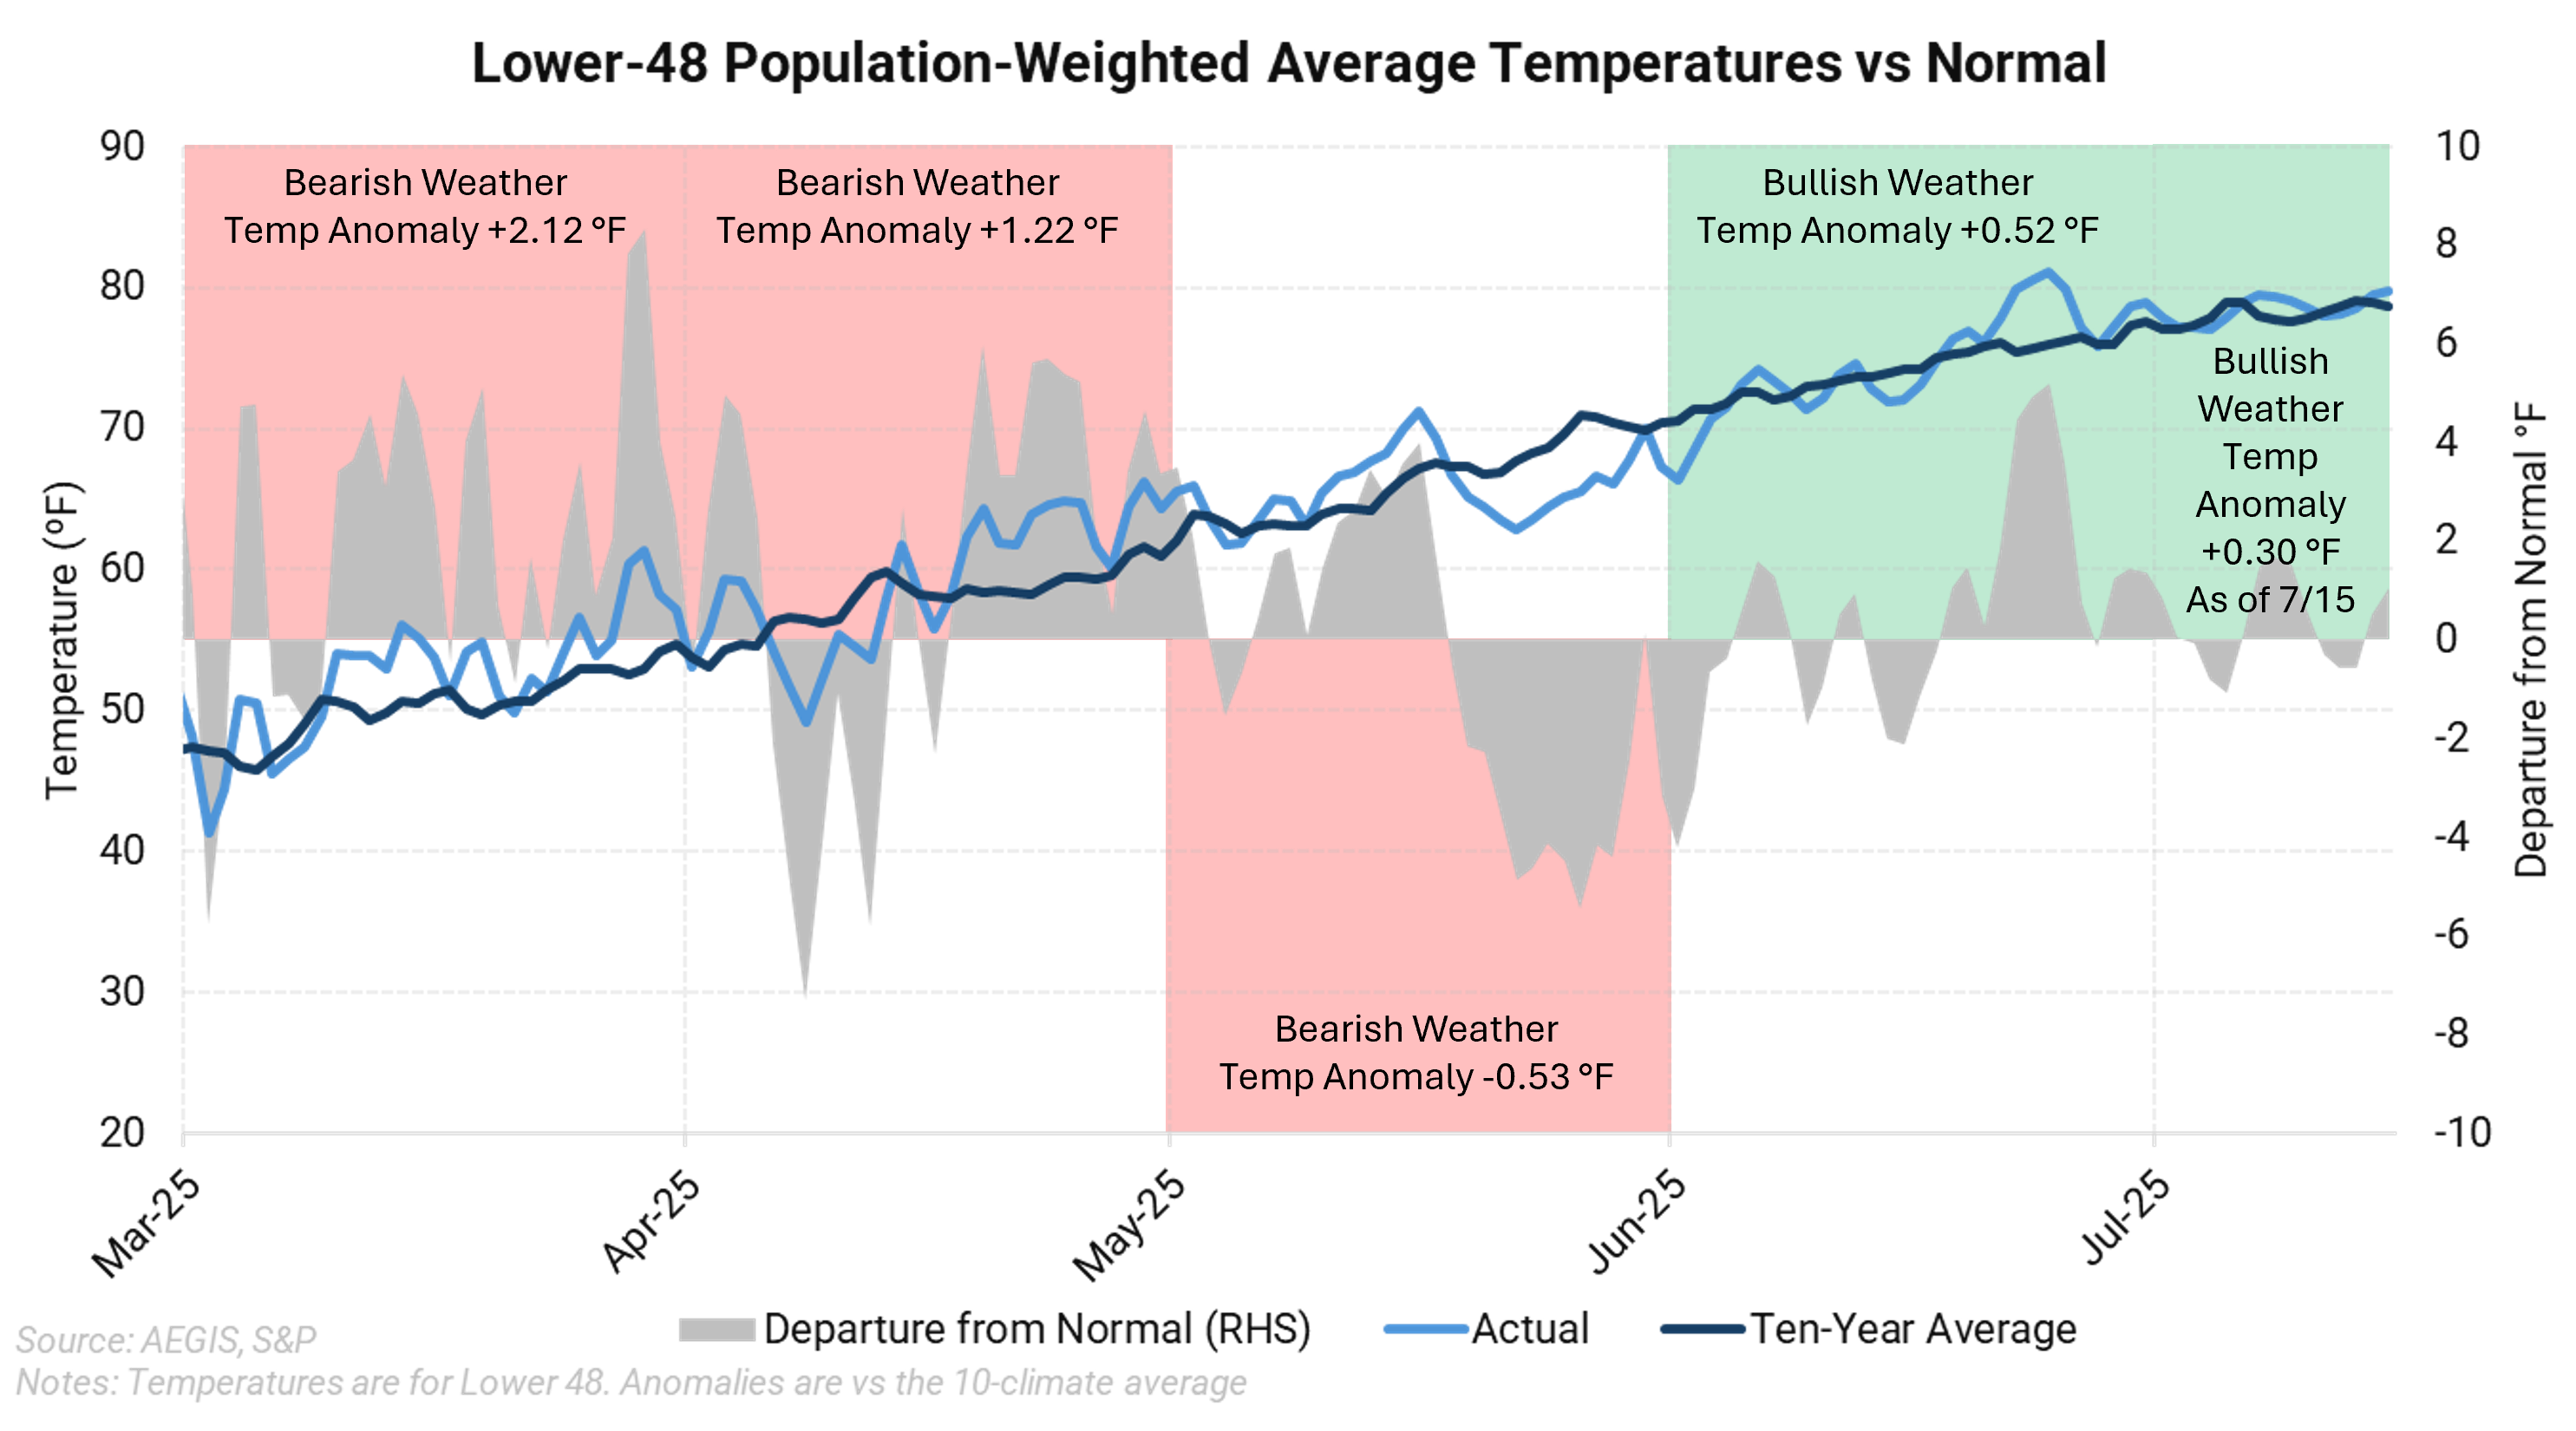
As highlighted in the red boxes, the months since March have trended bearish by this logic. This also aligns with some of the price depreciation observed in the natural gas market through the spring. Since June - particularly in late June - the weather has shifted net bullish as temperatures climbed above the ten-year average.
Weather plays an outsized role in the U.S. natural gas market. However, it is not the only driver, and prices do not move in perfect correlation with whether temperatures are above or below normal.
Looking ahead to the rest of summer, those hoping for higher natural gas prices will likely need sustained warmer-than-normal weather. Storage levels have increased rapidly since early March, and current projections suggest inventories heading into winter could be quite elevated.